Social protection in Turkey, too many words with too little content
Mustafa SÖNMEZ - Hürriyet Daily News February 2 2015 After 2003, while the ruling…
Mustafa Sönmez – Hürriyet Daily News October/13/2014
Economic growth during the Justice and Development Party (AKP) era was based on the inflow of foreign resources, concentrating on the domestic market. This has caused a quantitative increase in non-agricultural wage earners and also a growth in the inflow of salary/wage into households in the absolute sense.
However, the surplus created by this growth, at the same time, accelerated the seizure of the profit/interest rate/excessive income by the top segments of the pyramid. Moreover, there were significant increases compared to the previous period in the outflow of the surplus, which corresponded to the yearly $40 billion of foreign investments.
How, in this framework, was the share of this economic pie that grew about 5 percent annually? Has there been a recovery in the distribution in Turkey’s capitalism in this new climate? Has the inequality in the distribution of income lessened between the ones who are at the top of the population pyramid and the ones at the bottom?
TÜİK and income distribution
According to the income distribution surveys carried out yearly by the Turkish Statistical Institute (TÜİK), after the 2001 crisis the individual income distribution in Turkey moved to a more equal position.

As TÜİK’s income distribution data claims, in the years following the 2001 crisis, while the share from the total income of the first four groups of 20 percent starting from the very poor increased, the share of the richest 20 percent showed a constant decline. According to the same source, while the share of the first 20 percent who received the least share from total income was 5.3 percent in 2002, this figure went up to 6.6 percent in 2013. The share of the fifth group who received the biggest share from total income was 50 percent in 2002, while this went back to 45.2 percent in 2013. In parallel with this, the Gini coefficient, which shows the inequality in income distribution, was 0.44 in 2002 and went back to 0.38 in 2013.
What kind of a radical change was in question that decreased the incomes of the very top minority and increased the incomes of the families at the very bottom from the 1994 crisis to the 2001 crisis and from there to 2013? Several economists are asking this question and they express that it is a method issue in the income distribution survey repeated every year.
The method issue is this: In income distribution surveys, data is collected upon declaration. In other words, the selected households in the sample are visited and their incomes are asked and whatever they declare, that is accepted as correct. The “pie” that comes out is presented to the public as the distribution portrait and how it is distributed in 20 percent, 10 percent and 5 percent groups of the population.
Those who are criticizing this method are saying that collecting income data through declaration to estimate the pie is misleading unless it is cross tested with other data.
It is possible to see the unhealthiness of the data collected on the basis of declaration in the income distribution survey by comparing them with special consumption expenses.
 The results of the TÜİK income distribution survey reveal that in 2013, there were 20,635,000 households in Turkey and the average of each household’s annual income was 29,000 Turkish Liras. In this case, the total pie that has been shared has a size of 608 billion liras. However, the same TÜİK’s 2013 national income data say that households have in the same year spent 1,109 billion liras. In other words, if only the amount of spending is taken into consideration, it can be seen that the pie that looks as if being shared is 54 percent bigger. This particularly shows us that there are shortcomings in especially determining the incomes of profit, interest rate and rent in the pie. As a matter of fact, data that only considers a pie that is only 56 percent of the spending is far from a reliable one. Moreover, it has been this way for years and TÜİK does not have any effort to add the non-recorded declarations into the analysis to fill in its deficiency.
International rankings
While TÜİK’s “Income Distribution Statistics” that it has been conducting every year since 2003 with the same method and the outcome of which it releases presents very questionable results scientifically; again, from 2003 onward, there is an effort to pull down the Gini coefficient. In this period that coincides with the AKP regime, the Gini coefficient has been decreased from 0.42 to 0.38, creating an impression that distribution has entered a recovery process in this era. The income distribution inequality in Turkey has been sent to institutions, such as the OECD, World Bank and the EU with these produced Gini coefficients.
Despite all these, even if the latest Gini coefficient announced by TÜİK is accepted as truth, again, Turkey cannot escape being the country with the worst income distribution in Europe.

According to the European Statistics Office Eurostat, Turkey, even with its 0.38 Gini coefficient, is 8 points higher than the EU average of 0.30 Gini coefficients. Even the country closest to Turkey, Spain is three points behind Turkey. While Mediterranean countries such as Italy, Spain, Greece and Portugal are nearing Turkey in inequality, it can be seen that in North European countries the distribution is relatively fair. In these countries where the social state tradition prevails, the Gini coefficient is below 0.30. Distribution in Europe’s biggest, Germany, though, is more equal compared to other big countries, such as France and the United Kingdom.
In the world
The Gini coefficient of Turkey, which is presented as 0.38, does not take Turkey off of the list of the world’s worst income inequality countries.
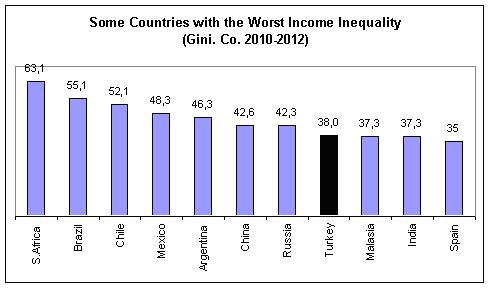
The World Bank and OECD data reveals that South Africa is by far the champion of income inequality. Even though the white minority was ousted from political power in 1994, the white minority continues to be the richest segment in the country, while the gap between the South Africans, most of who live in shanty towns, does not narrow.
While the Gini coefficient expresses absolute inequality with 1, South Africa is the closest country to 1 with its 0.63 coefficient.
While Brazil takes the second place with its 0.55 Gini coefficient, the gap in other South American countries Chile and Mexico is also remarkable.
Turkey, with its “revised” 0.38 injustice coefficient for 2012 comes after China and Russia, which experience major inequalities in their transformation into capitalism. Malaysia and India in Asia and Spain in Europe are the closest countries to Turkey in inequality.
Accurate data
In the light of all these facts, distribution continues to be an important issue for Turkey, but it is vague and behind a cloud about which direction in fact it is heading. Unfortunately, it is not easy to make a scientific evaluation because of the lack of production of accurate data. The findings of the survey carried out every year by TÜİK on income distribution contradicts with several realities; they are either insufficient or weak; and they fail to facilitate our comprehension of real distribution relations and their change from year to year.
The “Gross Domestic Product according to Income” issued by TÜİK every year was providing more accurate information on the distribution of the salary and non-salary surplus of the national income; however, as of 2006, this data production was ended without the need to make an explanation why.
The way to obtain accurate data on such topics as income distribution, which has political consequences as well as economic, is indeed through public institutions again. A healthier approach needs to be adopted in data gathering and methodology for an objective, scientific information production.